
The Proc file system is one of the most used simulated file systems in the Linux operating system. When the system reboots, this file system is created on the fly, and it is subsequently removed when the system suspends. It acts as the kernel’s controller and knowledge center, storing vital information about current operations. The proc file system is widely used to communicate between the kernel and Linux userspace.
In this article we will discuss how to use the proc file system in Ubuntu linux.
Information about the System
Investigating the properties of the /proc pseudo-filesystem and its ability to provide information about the running Linux system, examining the /proc structure, and discovering various information about the kernel and processes running on the system, are all part of the process of gathering information about the system.
Listing of directory content /proc
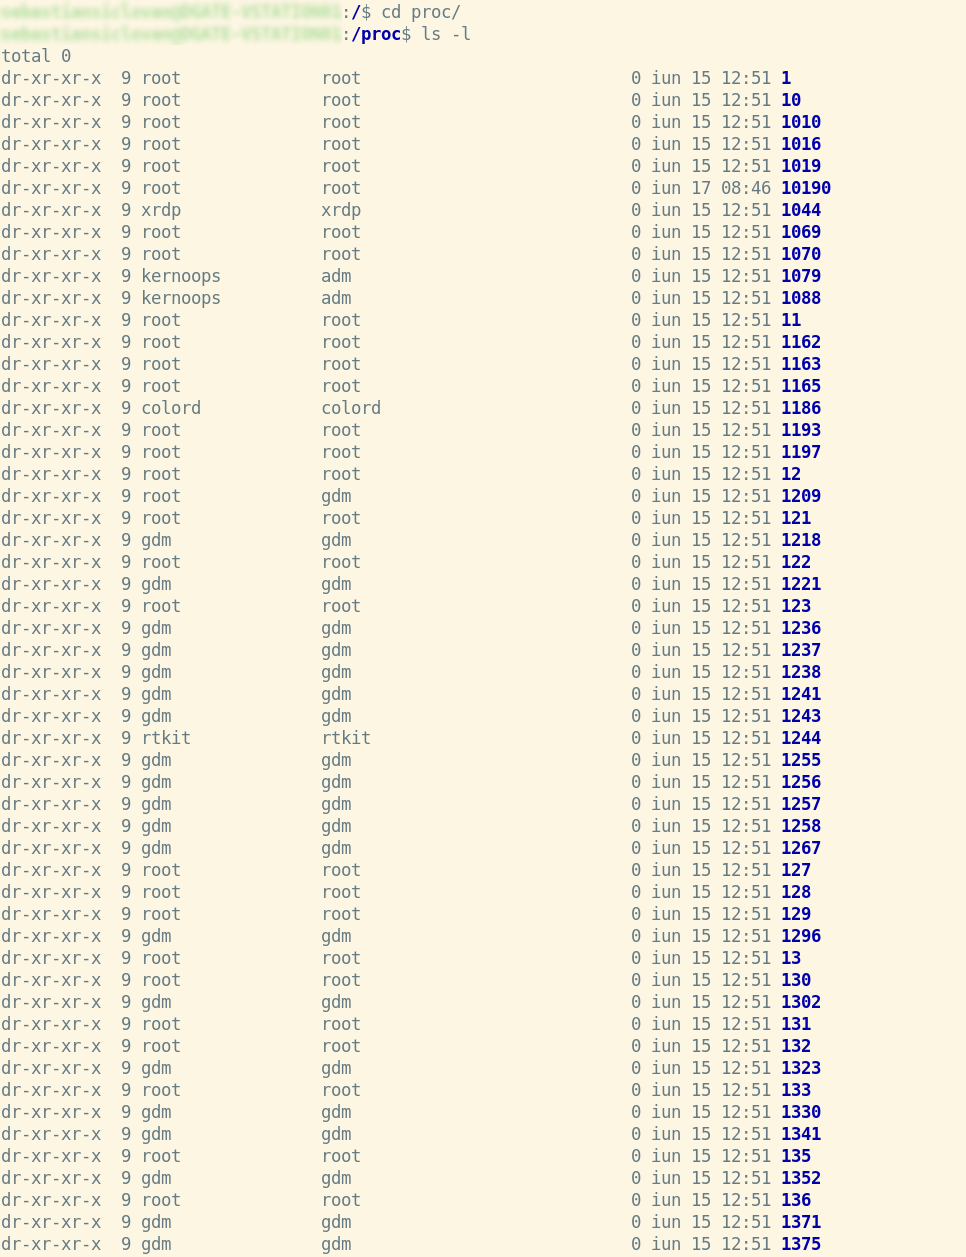
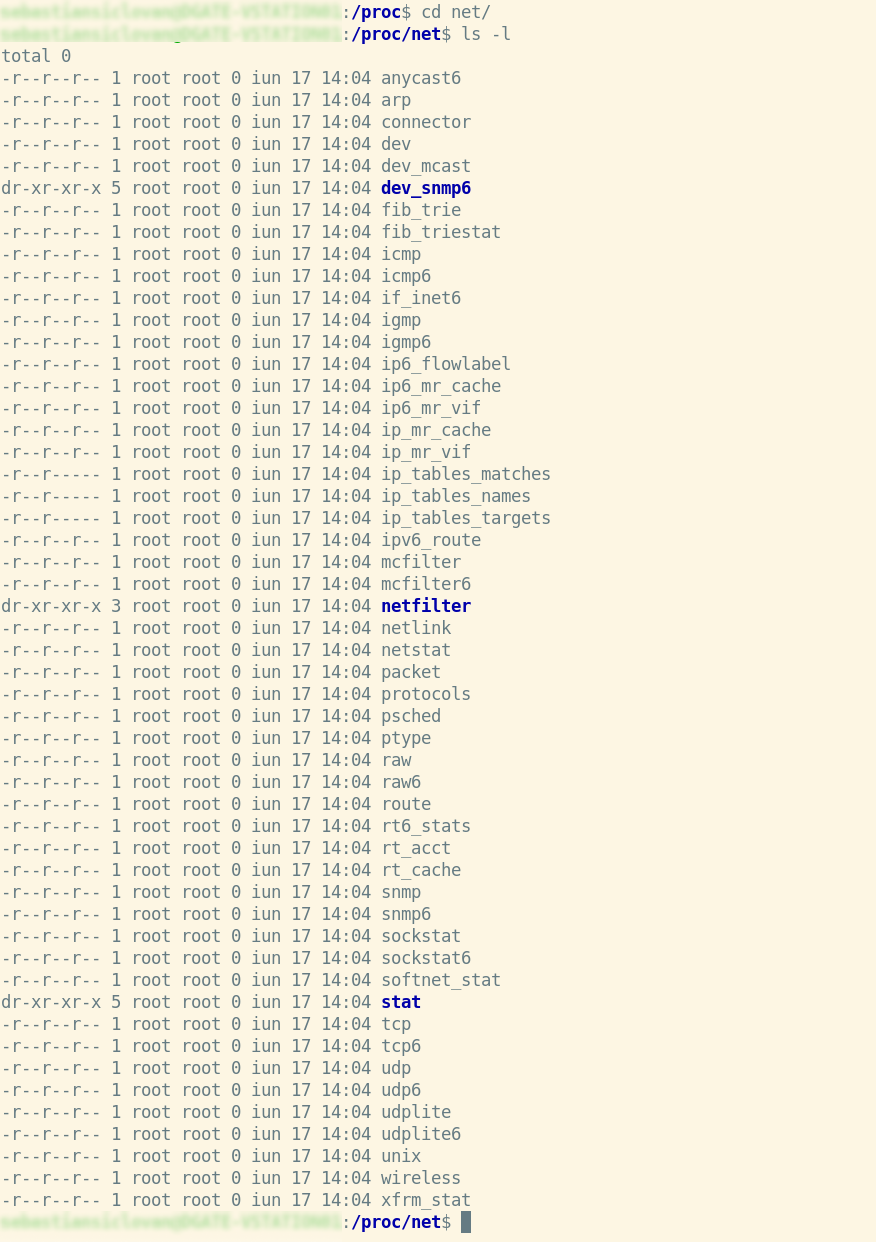
As a first step, we must be in the root directory (‘/’), from there we enter the /proc directory where we use the specific command to list the contents of a directory for additional information.
					 cd /proc
 ls -l
Also, to view only the directories in /proc we use:
ls –d */
You’ll see that each PID of a process has its own directory if you list the directories.
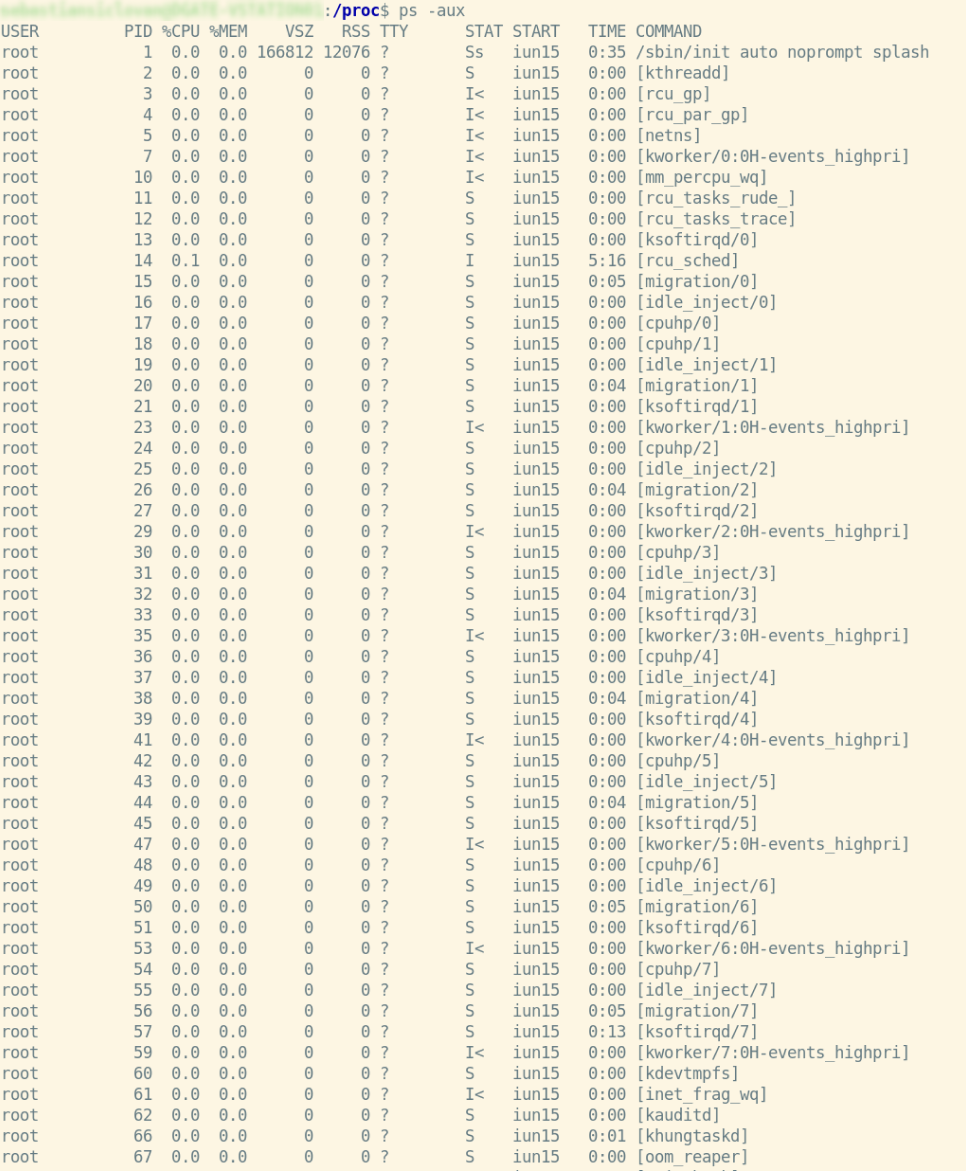
Now let’s look for a specific process with a specific PID, you can retrieve the PID of any process currently running via the ps command.
ps –aux
We can also make selections for our processes using the command below.
ps -eo user,pid,ppid,cmd,%mem,%cpu --sort=-%mem
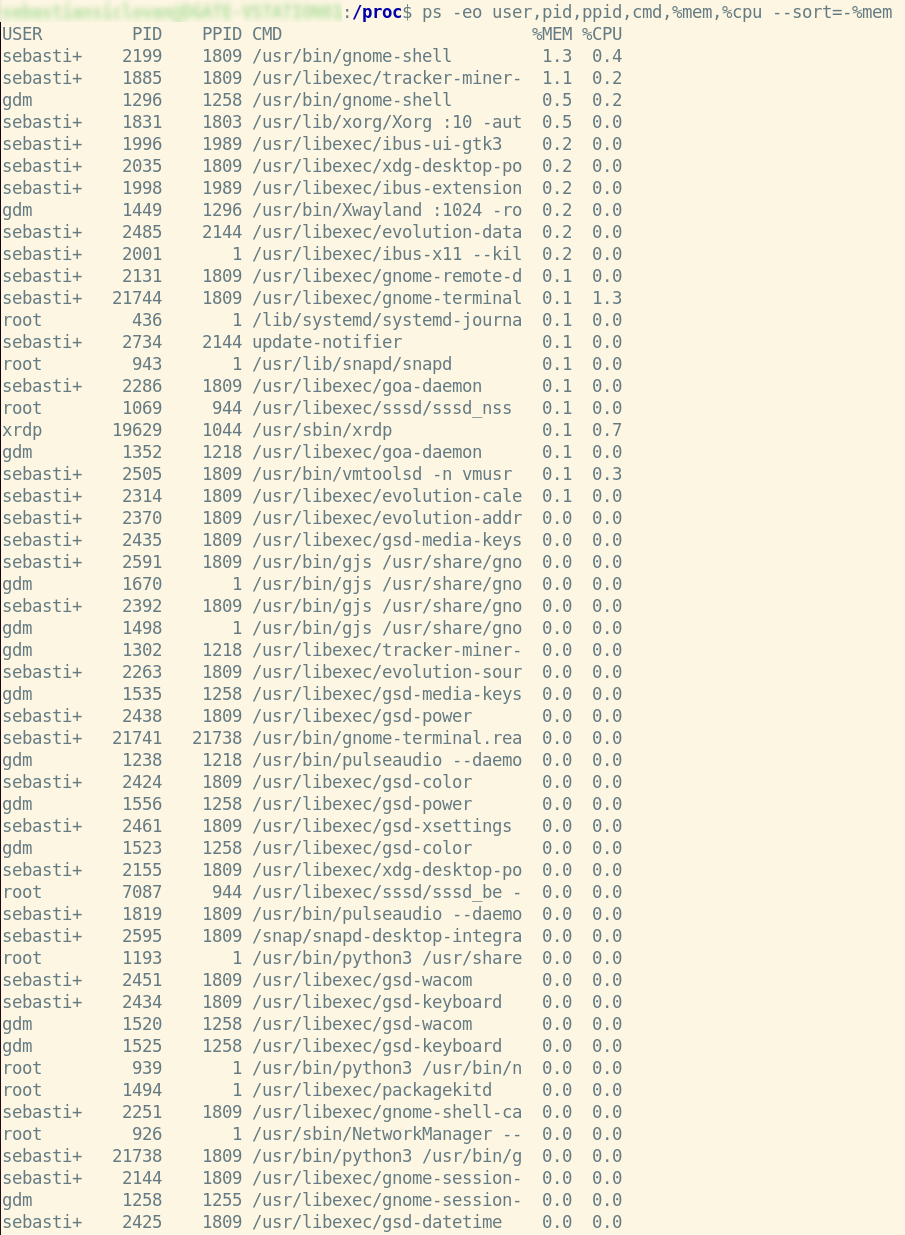
As you can see, after executing this command, we will only see the columns that were given in the command, such as user, pid, ppid, cmd, memory utilized by each process, and cpu, in the list of our processes.
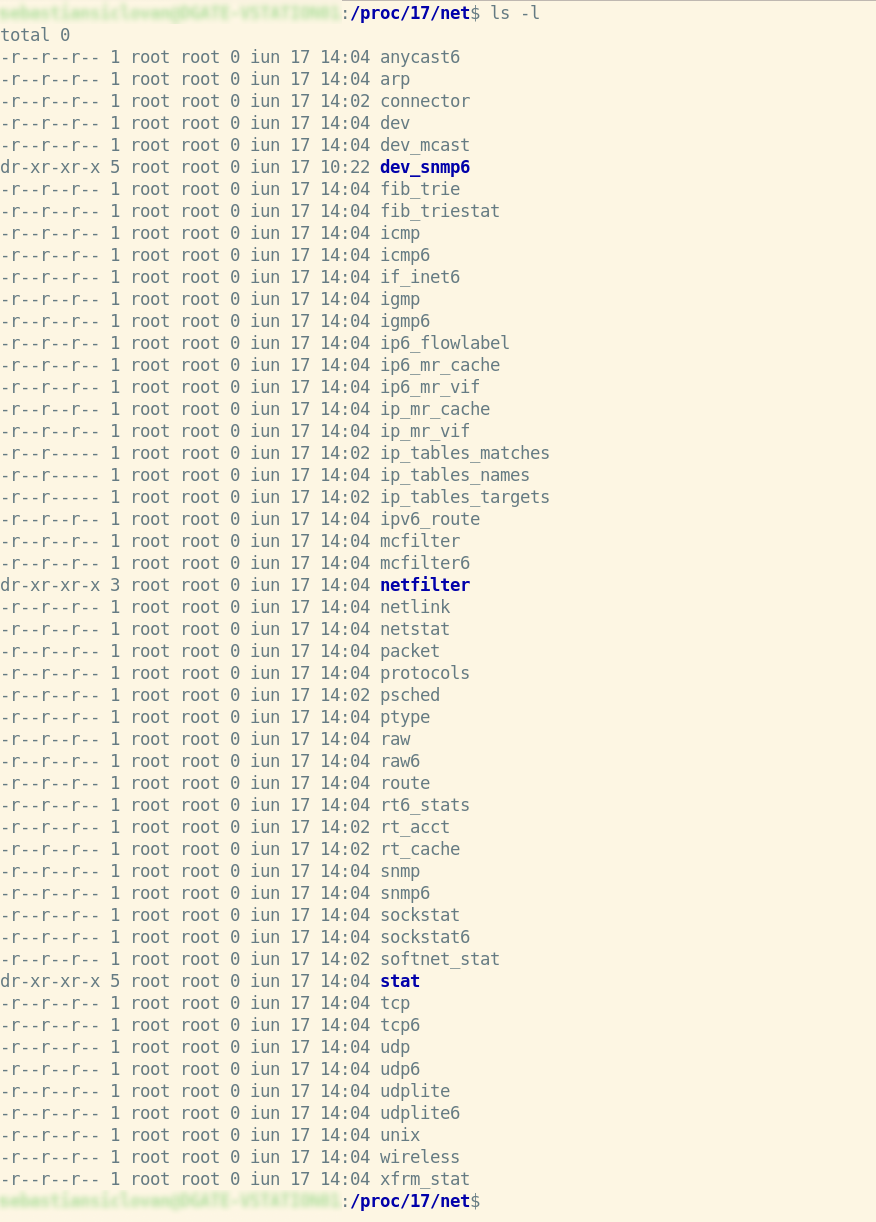
Now let’s see more details about a process, let’s take as an example the process with PID = 17.
					 cd 17
 ls –l
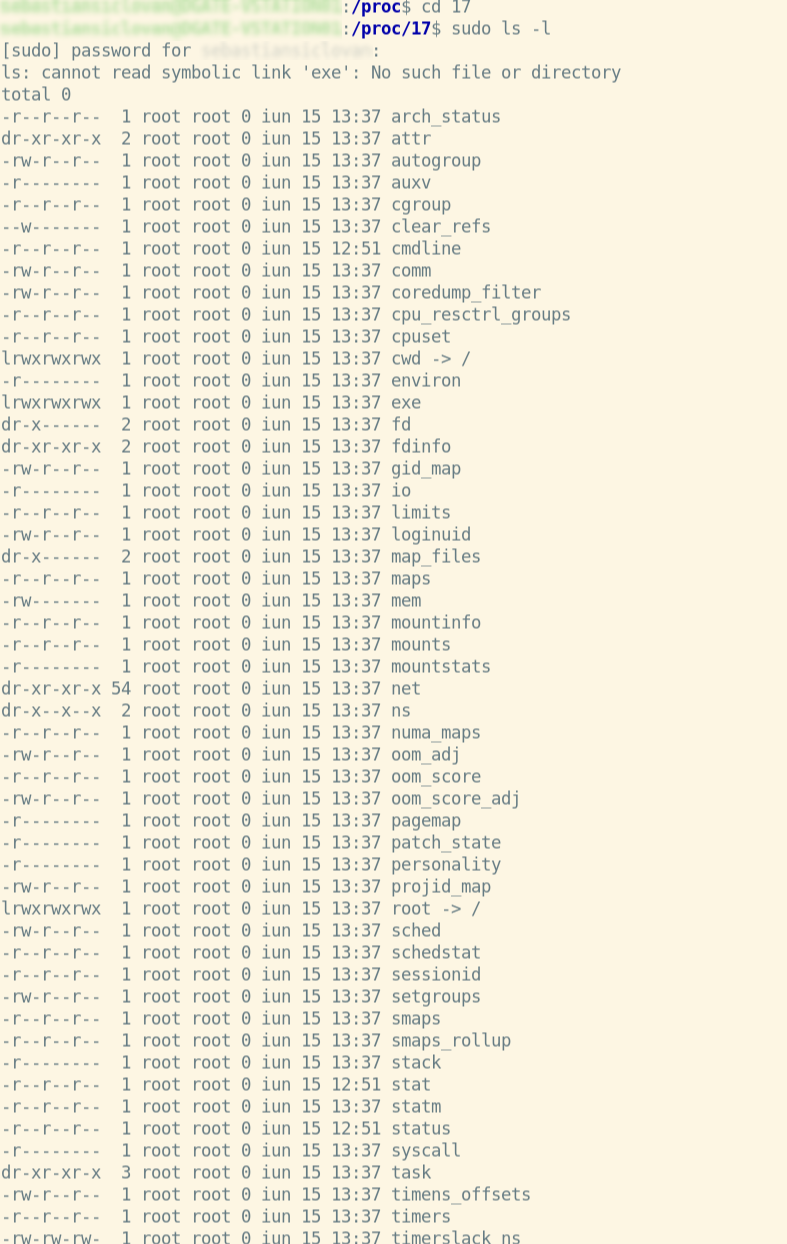
Under Linux, the /proc directory contains a directory for each running process, including kernel processes, in directories labeled /proc/PID.
Here are the directories that are present:
File | representation |
|---|---|
/proc/kmsg | The messages produced by the kernel are stored in this file. Other programs, such /sbin/klogd or /bin/dmesg, then take up these messages. |
/proc/scsi | Any devices linked through a SCSI or RAID controller are listed here. |
/proc/tty | current terminal information |
/proc/version | contains the Linux kernel version, distribution number, gcc version number (used to generate the kernel), and any other relevant information about the current kernel version |
/proc/crypto | a list of cryptography modules that are currently available |
/proc/diskstats | information about each logical disk device (including device numbers) |
/proc/ filesystems | a list of the file systems that the kernel supported at the time of listing |
/proc/meminfo | The current and previous CPUs on which it was run. |
/proc/17/cwd | This is a symbolic link to the current working directory of the process. |
/proc/17/environ | an overview of the kernel's memory management |
Additionally, as you can see in /proc, we may have files in addition to directories.
These files are:
File | representation |
|---|---|
/proc/kmsg | The messages produced by the kernel are stored in this file. Other programs, such /sbin/klogd or /bin/dmesg, then take up these messages. |
/proc/scsi | Any devices linked through a SCSI or RAID controller are listed here. |
/proc/tty | current terminal information |
/proc/version | contains the Linux kernel version, distribution number, gcc version number (used to generate the kernel), and any other relevant information about the current kernel version |
/proc/crypto | a list of cryptography modules that are currently available |
/proc/diskstats | information about each logical disk device (including device numbers) |
/proc/ filesystems | a list of the file systems that the kernel supported at the time of listing |
/proc/meminfo | The current and previous CPUs on which it was run. |
Viewing the contents of files in the /proc directory
Let’s go further on the example with process PID = 17 and see the content of the status file in it with a specific command.
cat /proc/17/status
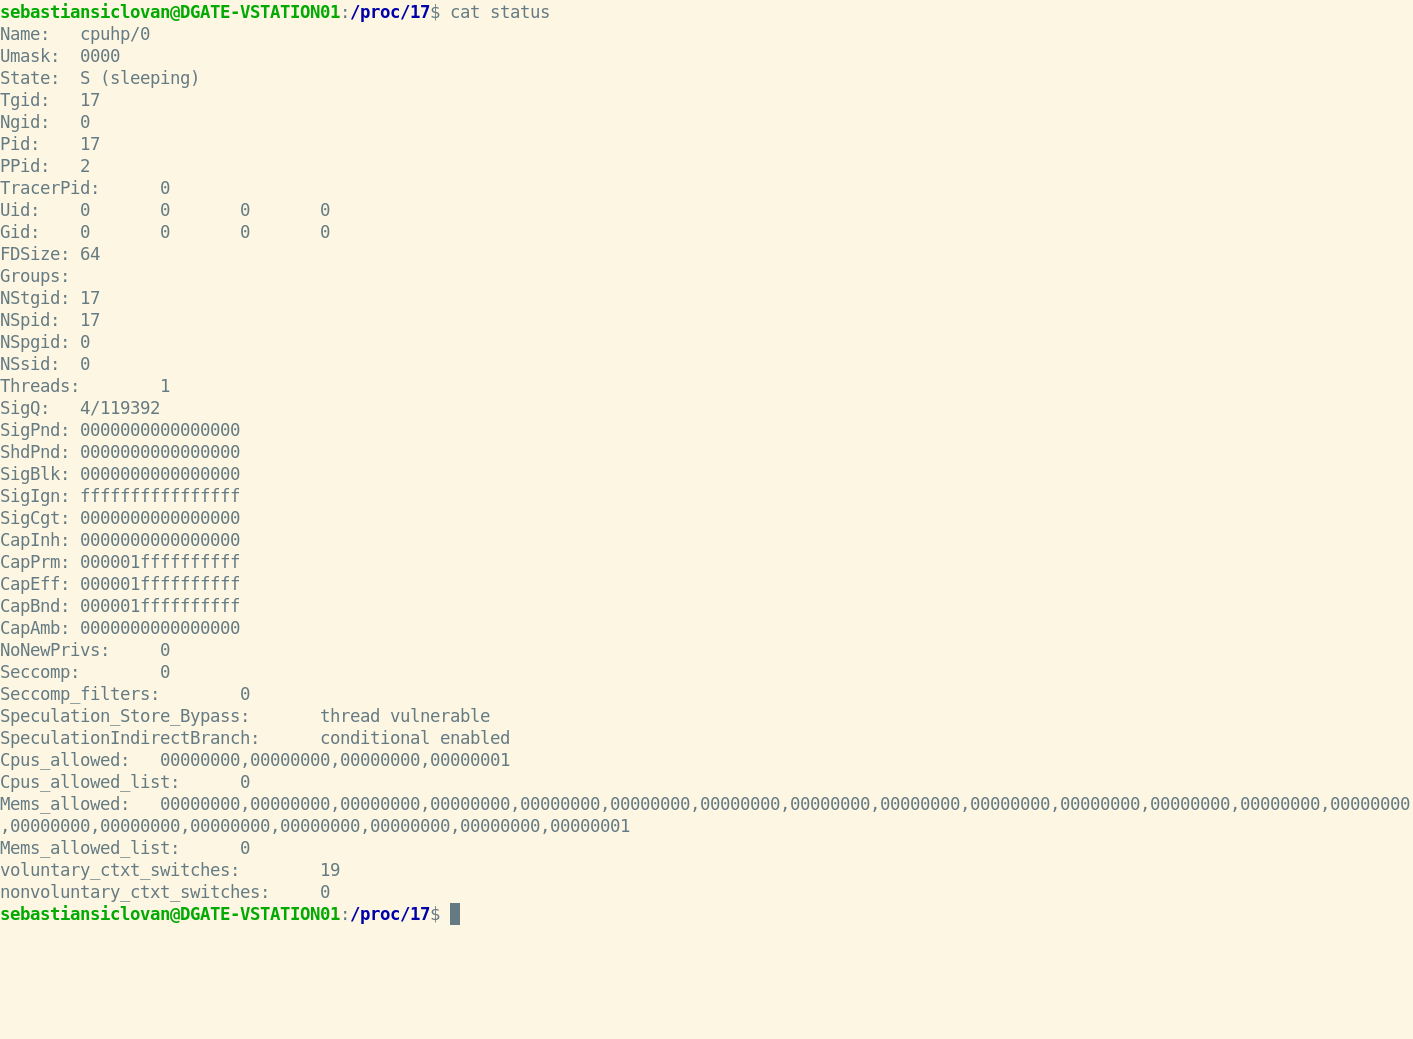
Content of status files:
section | Content |
|---|---|
Name | the executable's filename |
Umask | mask for the generation of files |
State | imply (R is running, S is sleeping, D is sleeping in an uninterruptible wait, Z is zombie, T is traced or stopped) |
Tgid | ID of the thread group |
Ngid | Group ID for NUMA (0 if none) |
Pid | id of the procedure |
PPid | the parent process's process id |
TracerPid | Process ID for tracking this process (0 if not) |
Uid | UIDs for the real, effective, saved set, and file system |
Gid | GIDs for the real world, the saved set, and the file system |
FDSize | currently allocated number of file descriptor slots |
Groups | list of further groups |
NStgid | Hierarchy of descendent namespace thread group IDs |
NSpid | Hierarchy of descendant namespace process IDs |
NSpgid | Hierarchy of descendant namespace process group IDs |
NSsid | Hierarchy of descendent namespace session IDs |
VmPeak | amount of virtual memory at its peak |
VmSize | size of the entire program |
VmLck | memory capacity that has been locked |
VmPin | size of pinned memory |
VmHWM | "High water mark" for resident set size |
VmRSS | size of memory chunks It is made up of three pieces (VmRSS=RssAnon+RssFile+RssShmem) |
RssAnon | memory amount of anonymous residents |
RssFile | the number of file mappings that are stored locally |
RssShmem | resident shmem memory size (includes SysV shm, mapping of tmpfs, and shared anonymous mappings) |
VmData | private data segment size |
VmStk | the length of stack segments |
VmExe | the length of the text portion |
VmLib | the code size of the shared library |
VmSwap | the amount of swap that anonymous private data consumes (shmem swap usage is not included) |
HugetlbPages | hugetlb memory chunk size |
CoreDumping | The memory of the process is now being emptied (killing the process may lead to a corrupted core) |
THP_enabled | When PR SET THP DISABLE is set on the process, it returns 0 if the process is authorized to utilize THP. |
Threads | the total number of threads |
SigQ | amount of queued signals/maximum number of queued signals |
SigPnd | a bitmap containing the thread's pending signals |
ShdPnd | for the process, a bitmap of shared pending signals |
SigBlk | signal-blocking bitmap |
SigIgn | Bitmap of Signals Ignored |
SigCgt | representation of intercepted signals |
CapInh | a bitmap of inheritable skills |
CapPrm | a bitmap representing the available capabilities |
CapEff | a bitmap of useful abilities |
CapBnd | boundary set of capabilities bitmap |
CapAmb | Ambient capabilities bitmap |
NoNewPrivs | prctl(PR GET NO NEW PRIV,...) and no new privs are examples of no new privs. |
Seccomp | prctl(PR GET SECCOMP,...) in seccomp mode |
Speculation_ Store_Bypass | Possible mitigation status for shop bypass |
Speculation IndirectBranch | form of indirect branch conjecture |
Cpus_allowed | This method may execute on a set of CPUs called a mask. |
Cpus_allowed _list | Same as before, except this time in "list format" |
Mems_allowed | This procedure is permitted to use a mask of memory nodes. |
Mems_allowed _list | Same as before, except this time in "list format" |
Voluntary_ctxt _switches | the number of context transitions made voluntarily |
Nonvoluntary_ ctxt_switches | the amount of context shifts that are not voluntary |
Detailed network information in the /net directory of /proc
Now let’s see the contents of the net file from the PID = 17 processes exemplified above:
Some information about the network in the process directory analysis:
File | Content |
|---|---|
Raw | raw data from the device |
Route | The routing table for the kernel |
Netlink | PF NETLINK sockets are listed in alphabetical order |
Wireless | Data from the wireless interface (Wavelan etc) |
Udp | Sockets that use UDP |
Tcp | Sockets over TCP |
Unix | Sockets in the UNIX domain |
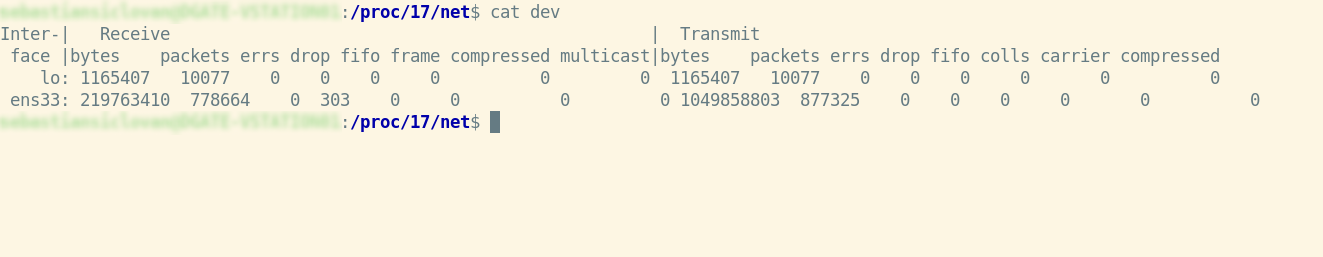
Dev | devices with statistics on the network |
Arp | ARP table in the kernel |
Viewing a network-specific file, in this case, the file dev:
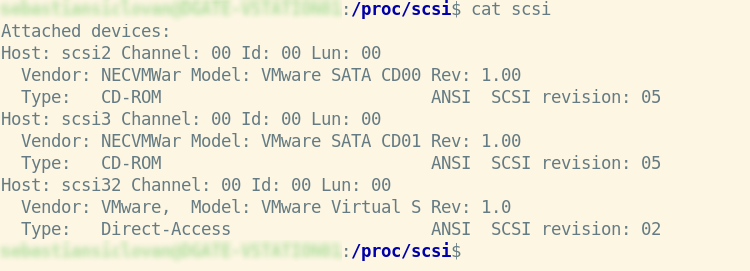
Detailed information about SCSI
In /proc/scsi, if your system has a SCSI host adapter, you’ll see a subfolder named after the adapter’s driver. In /proc/scsi, you’ll find a list of all known SCSI devices.
/proc/tty contains TTY information
The /proc/tty directory contains information about the available and currently utilized ttys. There are entries for drivers and line disciplines in this directory, and we can view the material in more detail below.
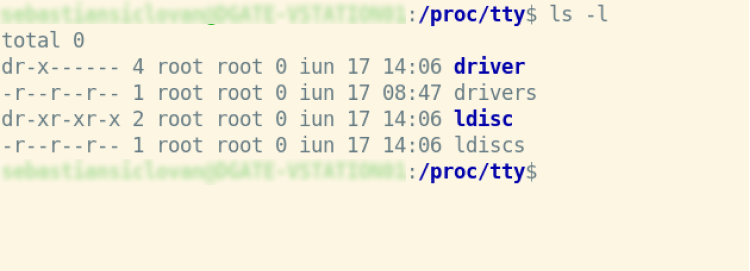
- Idiscs: all disciplines that have been registered
- Drivers: a list of drivers and how they’re used
- Driver/serial: Single tty line utilization statistics and status
/proc/stat contains a variety of kernel statistics
The /proc/stat file contains many bits of information concerning kernel activity. All of the figures in this file are averages from when the system was originally started. Simply cat the file for a quick look:
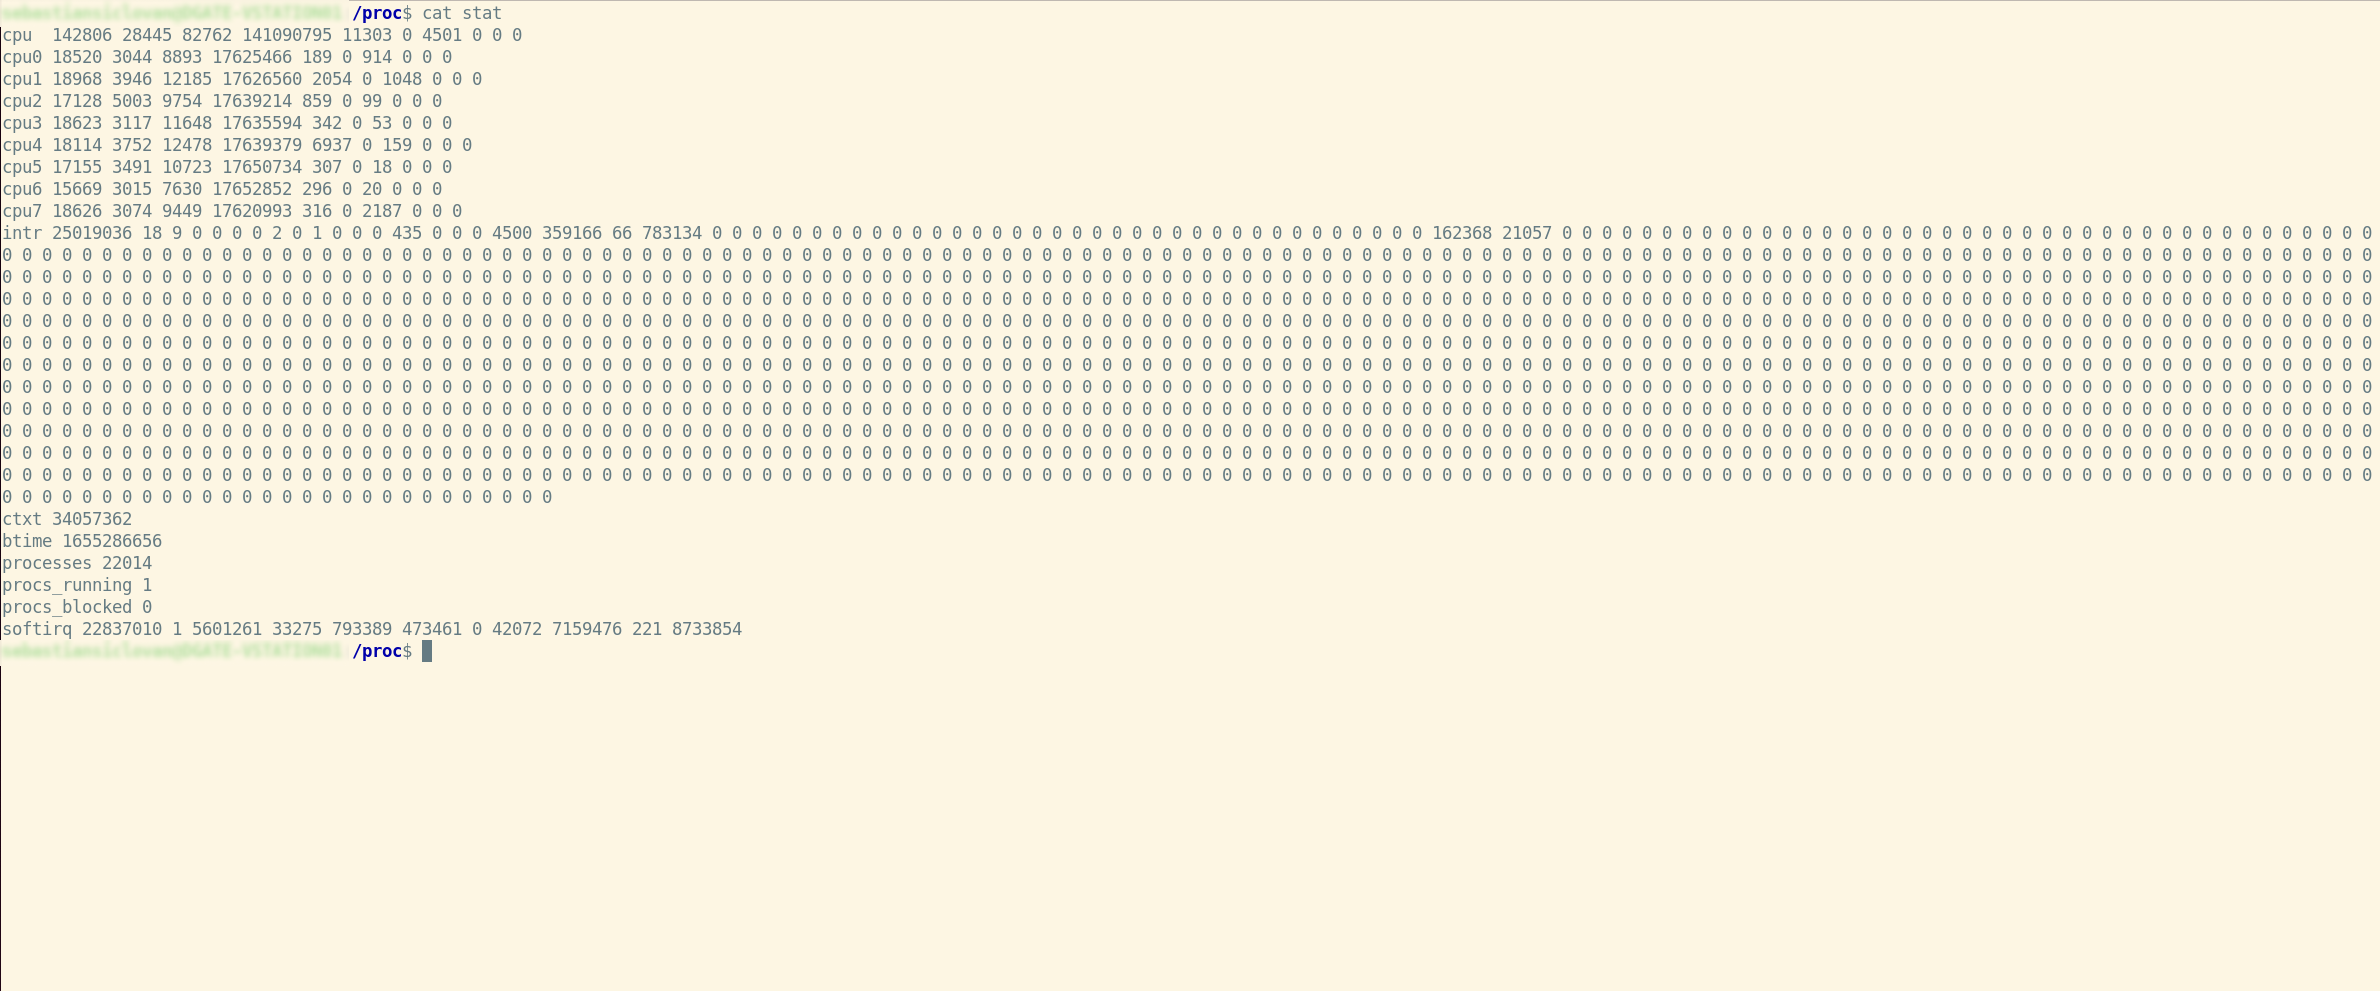
The numbers in all subsequent “cpuN” lines are added together in the initial “cpu” line. These figures show how much time the CPU has spent doing various types of tasks. Units of time are in USER HZ (typically hundredths of a second). From left to right, these are the meanings of the columns:
user | regular operations running in user mode |
system | operations carried out in kernel mode |
nice | processes running in user mode that are niced |
idle | twiddling thumbs |
iowait | iowait stands for waiting for I/O to complete |
irq | interruptions in service |
softirq | maintaining softirqs |
steal | unwilling waiting |
guest | use a standard guest |
guest_nice | running a gracious visitor |
- For each of the potential system interrupts, the “intr” line provides counts of interrupts handled since startup time. Each succeeding column is the total for that specific numbered interrupt, whereas the first column represents the total for all interrupts handled, including unnumbered architecture specific interrupts. Unnumbered interruptions are merely added to the total and not displayed.
- The total number of context switches across all CPUs is displayed on the “ctxt” line.
- According to seconds since the Unix epoch, the “btime” line indicates the time the system booted.
- The number of processes and threads created, including but not limited to those produced by calls to the fork() and clone() system functions, are listed in the “processes” line.
- The number of active or available threads is displayed in the “procs running” line (i.e., the total number of runnable threads).
- The number of processes that are currently blocked while awaiting I/O completion is displayed on the “procs blocked” line.
- For each of the potential system softirqs, the “softirq” line provides counts of softirqs that have been handled since boot time. The total for all softirqs serviced appears in the first column, and the total for each individual softirq appears in the following columns.
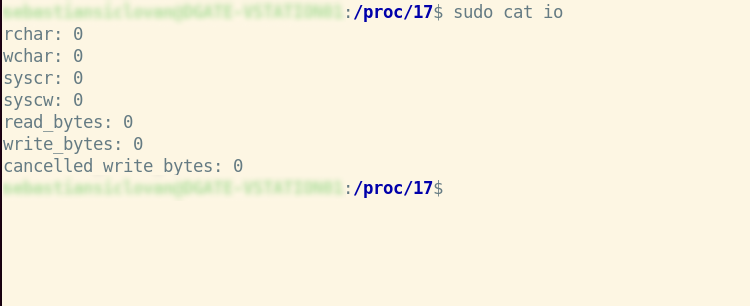
About parameters per process
Display of IO fields:
sudo cat /proc/17/io
Field | Description |
|---|---|
rchar | I/O counter: read characters The total amount of bytes read from storage as a result of this task. This is the total number of bytes supplied to read() and pread() by this process (). It includes tty IO, and it is unaffected by whether or not physical disk IO is necessary (the read might have been satisfied from pagecache). |
wchar | chars are written I/O counter The number of bytes written to disk by this job, or that will be written to disk by this task. As with rchar, there are certain caveats. |
syscr | read syscalls I/O counter Count the number of read I/O operations, such as read() and pread() syscalls (). |
syscw | write syscalls I/O counter Count the number of writing I/O operations, such as write() and pwrite syscalls (). |
Read_bytes | Count the number of bytes fetched from the storage layer using the I/O counter: bytes read. For block-backed filesystems, this is done at the submit bio() level. Please update the status of NFS and CIFS later. |
Write_bytes | Bytes wrote I/O counter Count the number of bytes that were transmitted to the storage layer as a result of this procedure. This is done during the page-cleaning process. |
Cancelled_ write_bytes | The key mistake here is the word truncate. When a process writes 1MB to a file and then deletes it, it is effectively doing no writeout. However, it will be recorded as causing 1MB of write. To put it another way, the amount of bytes that this process prevented from being consumed by truncating pagecache. A job can also result in "negative" IO. If this job truncates a filthy pagecache, some IO that has been accounted for (in its write bytes) by another task will be missed. We could merely deduct it from the write bytes of the truncating operation, but that would result in information loss. |
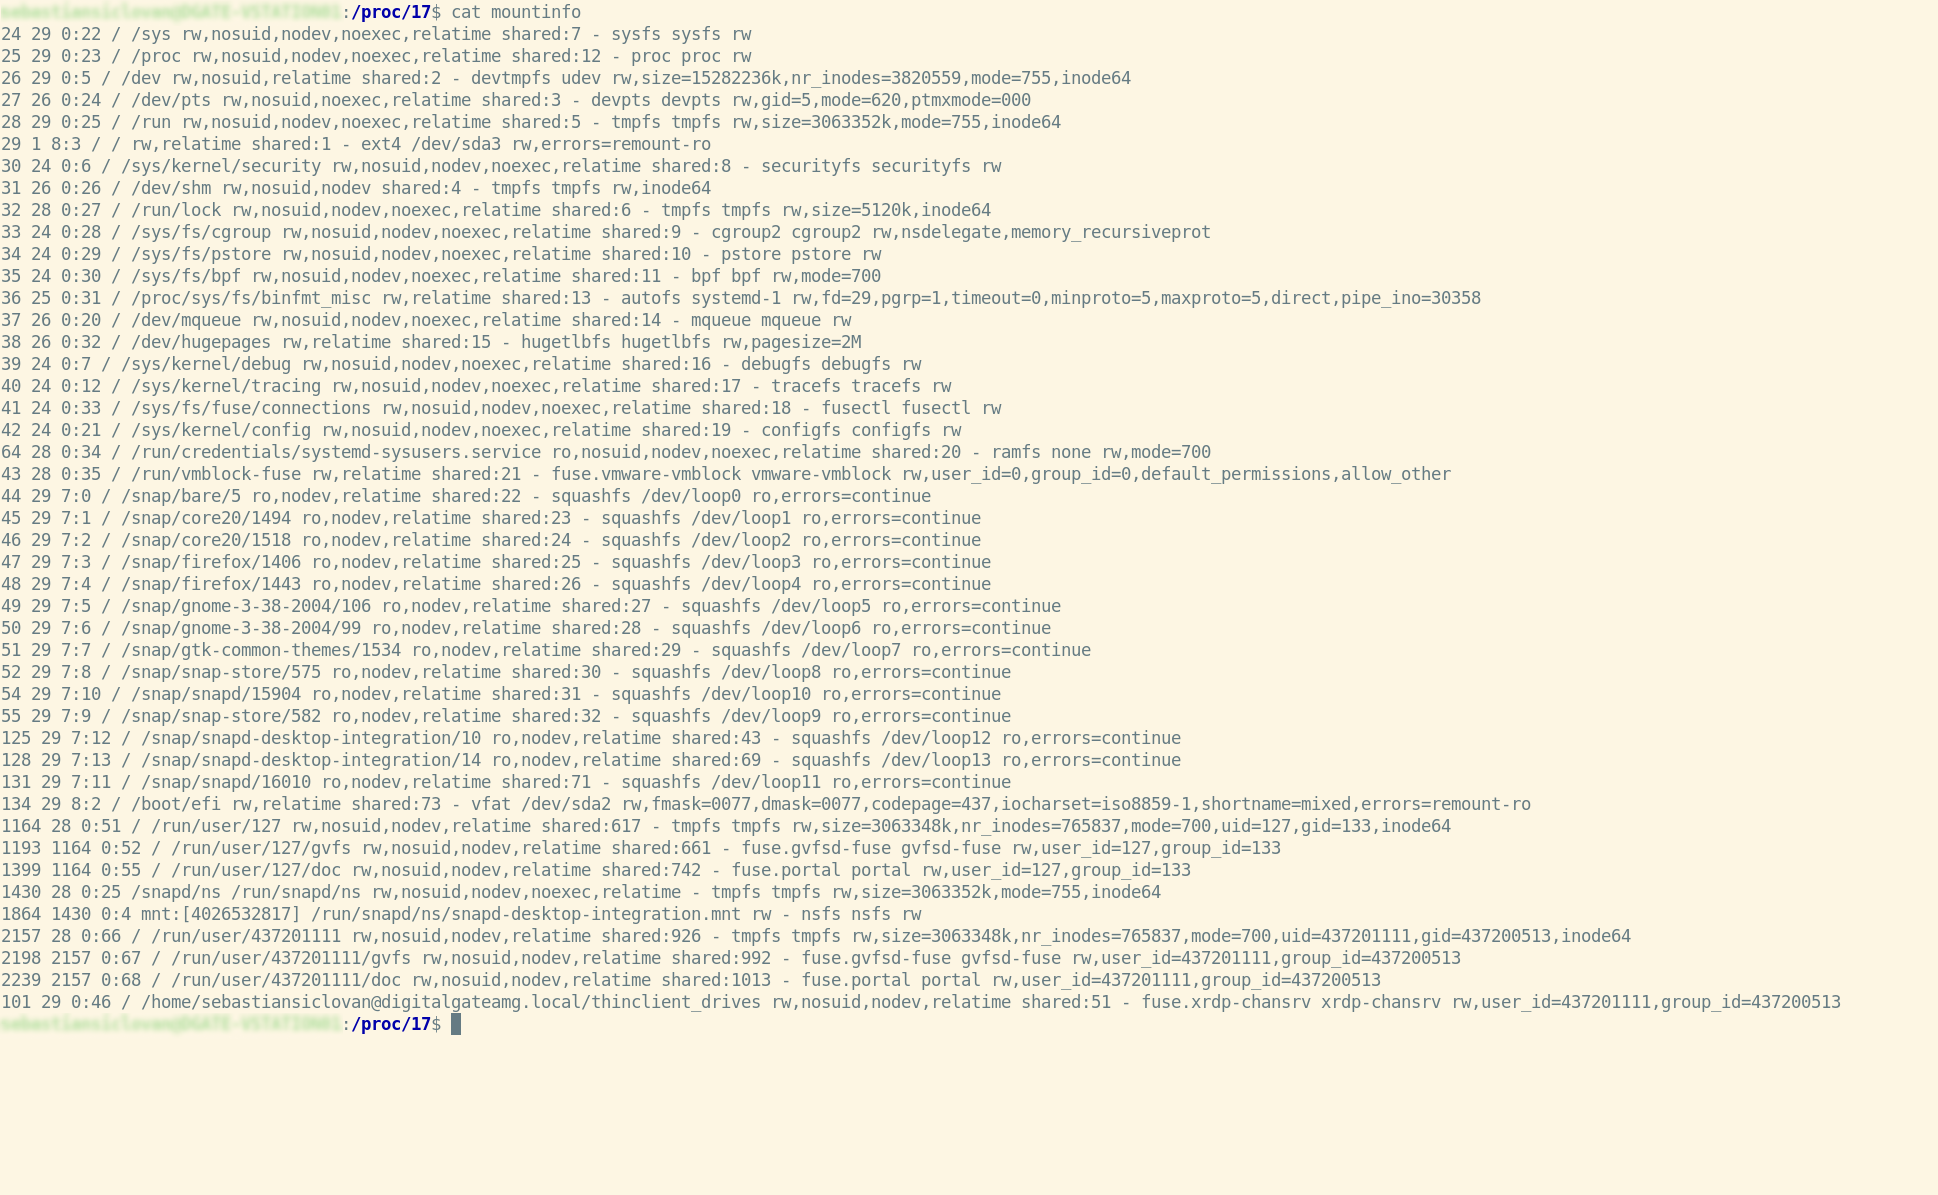
Display of IO fields:
Cat /proc/17/mountinfo
Summary
The /proc file system stores data about the current operating system. It not only gives you access to process data but also lets you read files in the hierarchy to get the kernel status.
The /proc directory layout represents the many sorts of data and makes it straightforward, although not obvious, to find specific data.
Certain parts of kernel behavior can be changed at runtime without recompiling or rebooting the system. The /proc/sys tree contains files that may be read as well as edited. You can change the kernel’s default settings by using the echo command to write values to these files.
References
Please check the following for further information on utilizing the proc Filesystem in Linux:
See other articles:

Important New C++ Features
C++ 20 and 23 have a lot of new features which can reduce boilerplate code, increase efficiency and make the code drastically more readable.

Embedded World 2023
DigitalGate is excited to announce its participation at the Embedded World 2023 organized in Nuremberg between 14.03 and 16.03. Come, and meet us at

Type erasure in C++
What is it? Type erasure is the technique used to hide the type meta-data of some data. When we store and manage data in

QEMU Development
Considering the current developments in the global market, especially having the issue of a Global Chip Shortage, there are some issues to be addressed

Yocto DevTool
A command-line utility by the name of DevTool serves as the foundation of the extensible SDK. With the help of this tool, you may

Advantages of Outsourcing
Nowadays, most embedded systems have functionalities implemented in software. The usage of embedded software by electronics manufacturers for expanded functionality, improved quality, and reusability